Health Inspection Score Inflation
The food safety industry faces a number of challenges such as deciding what should be enforced, how often a restaurant should be visited, and how to fund inspections [1]. When a restaurant receives a low grade, the restaurant must shut down and a re-inspection must take place once the violations have been corrected[1]. This requirement is financially damaging to both the inspecting authority and the restaurant[1]. As the situation currently stands, both the establishment and inspecting agency can benefit from a high inspection score. The agency saves money on having to perform anadditional inspection, and the restaurant gets to stay open.
In Wake County, North Carolina, the threshold for mandatory reinspection is set at a score of 80 on a 100 point scale. With these factors in mind, many in the industry are beginning to fear for the integrity of health inspections, and are seeking out answers. I’ve chosen to analyze the situation in Wake County in the hopes that we can better assess the state of their health inspections in North Carolina.
The Approach
All data was gathered from the public-access database at WakeCounty.gov. The two datasets I’ll be using consist of detailed inspection information such as number of critical violations, the inspector, and general comments. Additionally, a detailed list of specific violations committed by each restaurant for each inspection is contained within this data. Little cleaning was required as the Wake County database keeps a tight ship (thanks!).
To start off, I wanted to get a quick snapshot of the inspection score distribution.
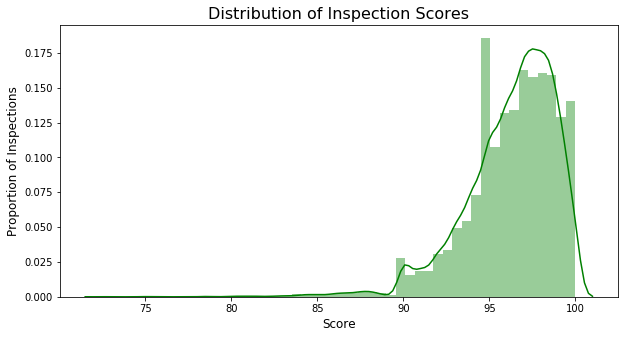
This distribution seems to be rather left-skewed, where very few inspections result in a score below a 90 (A-). Now to get a better idea of the average inspection, we should look at the relationship between the last day of inspection, and the inspection score given.
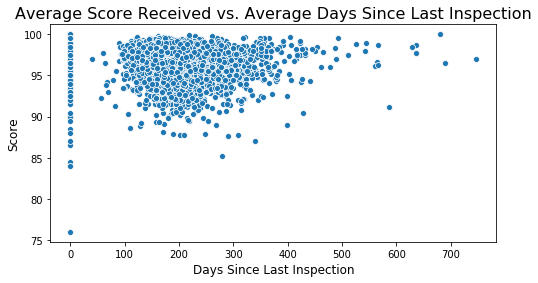
This is showing that restaurants tend to be visited in intervals of 100-400 days since their last inspection. Low-risk restaurants have looser inspection frequency requirement, this also explains why the inspections on the higher end also have slightly higher average scores (though uncommon). Another way we could measure inspection effectiveness is by checking if inspections improve over time.
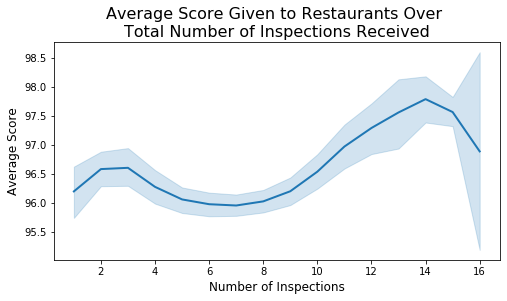
By checking this, we see that restaurants tend to have a small dip, but after ~8 inspections score seem to rise noticeably. This is potentially really good news, as it shows that inspections improve food safety at restaurants. To understand this better, we can take a closer look at how these restaurants are actually being scores by checking out the dsitributions for critical and non-critical food violations.
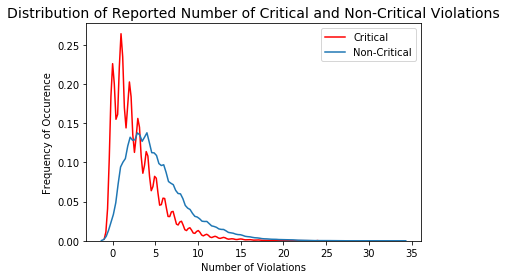
It seems like it is very rare for restaurants to have over 5 critical violations, or over 10 non-critical violations. If these findings can be trusted, then this is also great news. Any restaurant with low critical and non-critical violations most certainly deserves a high inspection score. Still, it’s important to note the size of this data set. Even though it appears that virtually no restaurants accumulate more than 10 violations, in reality several hundred restaurants still fall under this category. Even just one restaurant getting a score they don’t deserve can be dangerous for consumers, so it’s best to observe these outlier cases so as to ensure they were graded appropriately.
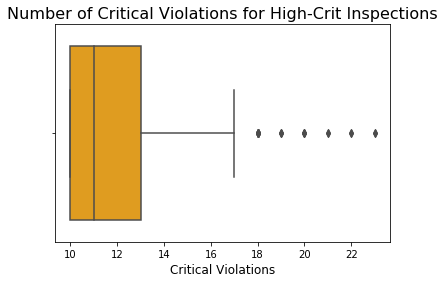
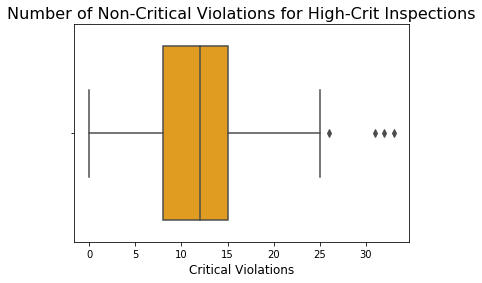

Judging by the interquartile ranges, it seems like most inspections with high critical violations seem to score anywhere from a 90-94, with 10-13 critical violations and potentially 10-15 non-critical violations. Now, at first glance, that seems like too high of a score for restaurants with so many violations, critical or not. Of course, each violation holds different weights that may or may not heavily impact the score. To better see what’s going on, we should look at what violations exactly are being recorded. Starting with the type of violation.
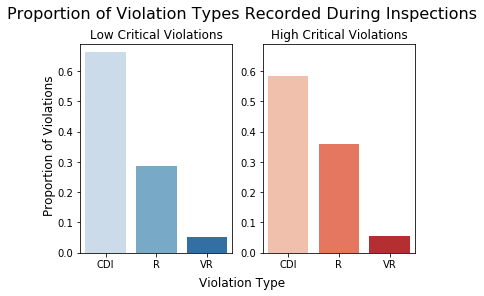
CDI: Corrected During Inspection | R: Repeat | VR: Verification Required
This figure highlights that inspections that record a higher count of critical violations, also report more frequent repeat offenses (R). Additionally, both plots suggest that an emphasis on correcting violations during the inspection itself is common practice. In a well-functioning system, repeat offenders that amass a high count of critical violations should receive lower scores. Given that critical violations are more likely to be repeated, it is good to understand exactly what offenses are most common
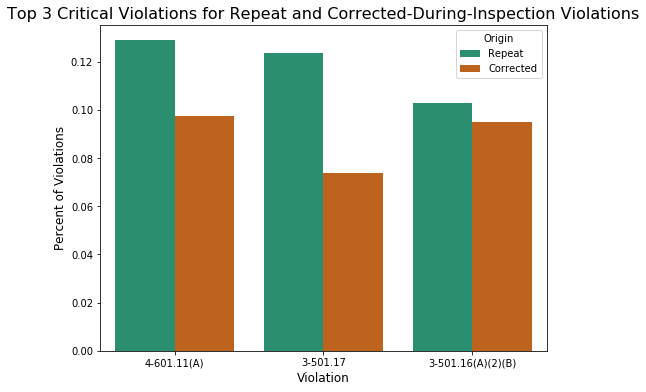
Top 3 Repeat Violations are Also the Top 3 Violations Most Often Corrected During Inspections
4-601.11(A)
- Food contact surfaces, non-food contact services, or utensils are dirty.
3-501.17
- Improper date markings on potentially hazardous foods.
3-501.16(A)(2)(B)
- Improper hot and cold food holding due to equipment not being capable of maintaining proper food temp.
Given this trend, it is safe to identify these critical violations as very common. As shown before, there is an inconsistent approach towards scoring, where a restaurant with ~20 critical violations can expect a score anywhere from 80-90. Given the severity of of these common violations, more efforts should be taken to reduce the overlap between repeated and corrected violations through more strict scoring policies. These new policies should work to provide consistent and accurate scores that punish consistent repeated violations.
Inspectors should also be trusted to be properly enforce these rules. But given the gravity and consistency of these violations, are inspectors accurately administering scores based on objective findings? Objectivity in grading should reduce repeat violations, and ensure that the department is operating with integrity. If not, then inspections are too arbitrary, and perhaps the weights of critical and non-critical violations should be increased.
To start checking this, we can look at the average score given out by individual inspectors. For starters, I’ll start with only the most experienced inspectors. An experienced inspector will be operationalized as one who makes up a large propotion of the inspections in the dataset, and making sure that they have also conducted at least 1000 inspections. I will include the top 10 inspectors.
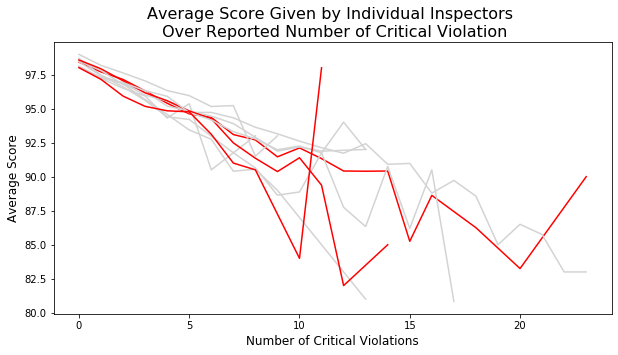
The three inspectors in red can be expected to inflate ratings as violations begin to increase. Scores begin to vary greatly after five critical violations. Though not all inspectors inflate scores to the same degree as the three highlighted examples. Keep in mind, this plot only includes the most experienced inspectors. Meaning they have each conducted at least 1000 inspections. Such trends could possibly be visible in other inspectors who have conducted less inspections, and are likely less experienced. Rather than plot every single inspector, we will statistically test to see how different these inspectors are from the group.
A quick t-test showed a strong statistical significance, showing that this group is different from the rest of the inspectors. This could mean two different things: either the other inspectors are more likely to inflate scores, or less likely. To better understand which it could be, it would be beneficial to visualize less experienced inspectors as well.
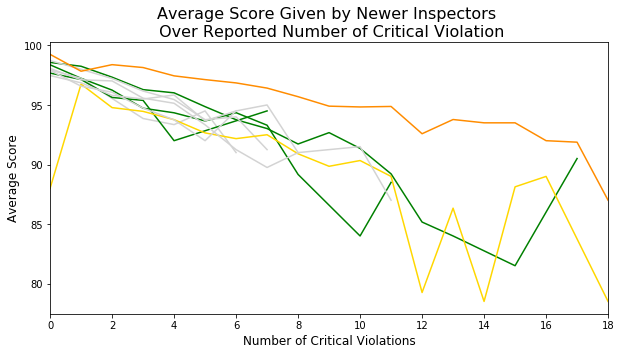
Here we see the trademark “V” shape trend that is characteristic of score inflation. Although these inspectors have not encountered cases where the number critical violations has exceed 18, they still show high volatility in their scoring. The inspector in yellow is a particularly interesting case, as their scoring methods show a highly zig-zagged trend. The inspector in orange that hovers above all the rest could be another sign of score inflation. While they do follow a negative linear trend, the average score they give out doesn’t shoot below a 90 until 18 critical violations are recorded.
This sort of inconsistent scoring pattern could be problematic. Both the inexperienced and experienced groups showed high volatility in ratings, as well as tendency to inflate scores. A levene test testing for homogeneity of variance also revealed that these groups also have different variances, which is in-line with what we’ve seen thus far
Discussion
Though score inflation could also be explained by other activities such as the nature of the violations. Our visualizations showed that it is rare for inspections to report over 10 critical violations. Perhaps the answer to this problem could be to further narrow down which violations count the most, and which are unneccesary. This fact should be kept in mind when extrapolating these findings to the greater population. The Top 3 violations that were identified should likely have their weights increased to discourage future infractions. Along with this, further narrowing down violations could improve scoring accuracy and consistency.
It also seems as though some inspectors are inflating inspection scores, further fanning the flames of this arbitrary grading. The exact motives for this cannot be confirmed here, but it should be noted that both parties (the restaurant and the inspecting agency) have something to gain from this. As violations pile up, a restaurants score is likely to decrease. Once a certain threshold is reached, the restaurant must close down, fix its violations, and be inspected once more. This process is both costly and time-consuming for an agency that is underfunded, and a restaurant that needs to stay in business. Nonetheless, Wake county should ensure that its inspecting force is performing with integrity, and that they are being equipped with the right criteria that will give restaurants the scores they have earned.
Reference
1) Stueven, Harlan. “Challenges of Health Department Food Safety Inspections.” Food Safety Magazine, www.foodsafetymagazine.com/enewsletter/challenges-of-health-department-food-safety-inspections/.